- A renter on a $2,000-a-month budget can afford an 1,103-square-foot apartment, up from 1,029 square feet when rents peaked in 2022.
- Renters are getting more bang for their buck thanks to the recent apartment construction boom, which has led to asking rents stabilizing below their pandemic peak.
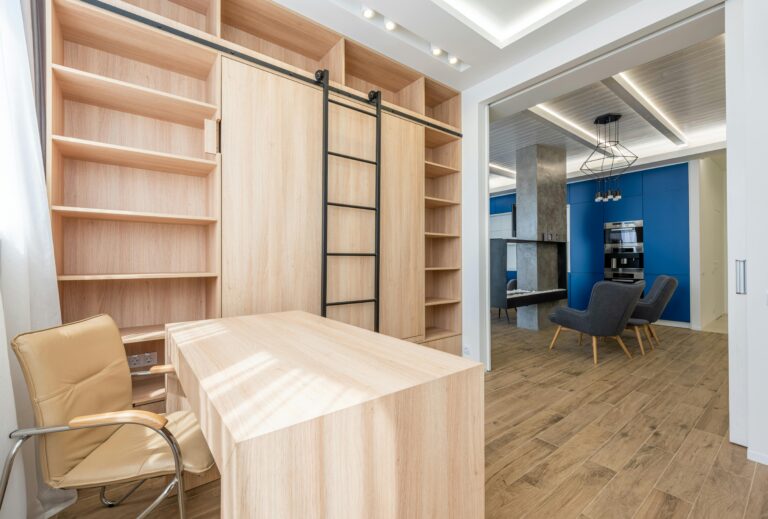
- In Memphis, $2,000 is enough for a 1,570-square-foot apartment, nearly three times the size of a $2,000 apartment in San Jose, CA.
A U.S. renter on a $2,000-a-month budget can afford an apartment that is more than 70 square feet larger today than it was when rents peaked in mid-2022.
The median U.S. apartment asking rent in October was $1,615. That equates to a median price per square foot of $1.81, meaning the projected apartment size for a $2,000 budget would be 1,103 square feet.
The median asking rent peaked at $1,700 in August 2022 when the typical apartment was listed at an all-time high of $1.94 per square foot, equating to a 1,029 square foot apartment for a $2,000 budget—74 square feet smaller than today. That’s the equivalent size of a small home office.
| Rental Budget (Monthly) | Projected Apartment Size (Oct 2024) | Projected Apartment Size (Aug 2022) | Difference 2022→2024 |
| $1,000 | 551 square feet | 514 square feet | +37 square feet |
| $1,500 | 827 square feet | 771 square feet | +56 square feet |
| $2,000 | 1,103 square feet | 1,029 square feet | +74 square feet |
| $2,500 | 1,379 square feet | 1,286 square feet | +93 square feet |
| $3,000 | 1,654 square feet | 1,543 square feet | +111 square feet |
That’s according to an analysis of the median price per square foot for apartments in buildings with five or more units that are listed on Redfin.com or Rent.com. By examining the square footage and asking rents for listed apartments, we project the size of apartments that can be rented for a range of budgets between $1,000-$3,000 a month.
Five years ago in October 2019, before the pandemic housing boom caused rents to spike, the U.S. median asking rent was $1,337, equating to $1.47 per square foot. That means the projected apartment size for a $2,000 budget was 1,359 square feet—256 square feet larger than today. For context, the average bedroom in the U.S. is roughly 130 square feet.
!function(){“use strict”;window.addEventListener(“message”,(function(a){if(void 0!==a.data[“datawrapper-height”]){var e=document.querySelectorAll(“iframe”);for(var t in a.data[“datawrapper-height”])for(var r=0;r<e.length;r++)if(e[r].contentWindow===a.source){var i=a.data["datawrapper-height"][t]+"px";e[r].style.height=i}}}))}();
window.tude = window.tude || { cmd: [] };
tude.cmd.push(function() {
tude.refreshAdsViaDivMappings([
{
divId: ‘news-desktop’,
baseDivId: ‘pb-slot-News_InlineVideo’,
}
]);
});
“Renters are getting more bang for their buck than they were during the pandemic because asking rents have since stabilized below their record high and incomes have continued to climb,” said Redfin Senior Economist Sheharyar Bokhari. “Rental affordability has improved thanks to the recent apartment construction boom, especially in Sun Belt states. That trend is likely to continue into 2025, as there are a lot of still-to-be-finished apartment buildings due to come online.”
Renters get more value for money in larger apartments
Generally speaking, smaller apartments have a higher price per square foot than larger apartments.
In October, one square foot of space in a 0-1 bedroom apartment cost $2.09, while in a 3+ bedroom apartment, it only cost $1.51.
| Median Asking Rent
(October 2024) |
Price Per Square Foot
(October 2024) |
Square Footage
($1,000 Budget) |
Square Footage ($1,500 Budget) | Square Footage ($2,000
Budget) |
Square Footage ($2,500
Budget) |
Square Footage ($3,000
Budget) |
|
| 0-1 Beds | $1,473 | $2.09 | 478 | 717 | 956 | 1,196 | 1,435 |
| 2 Beds | $1,695 | $1.62 | 617 | 925 | 1,234 | 1,542 | 1,850 |
| 3+ Beds | $1,980 | $1.51 | 663 | 995 | 1,326 | 1,658 | 1,989 |
Part of the reason the price per square foot is higher for smaller 0-1 bedroom apartments is because they are more concentrated in densely populated metros like New York, where rents are more expensive.
A Renter on a $2,000 Budget in Memphis Can Get 1,000 More Square Feet Than a San Jose Renter on the Same Budget
Geography also plays a major role in determining the size of an apartment that can be rented for a specific budget. A renter on a $2,000-a-month budget can afford an apartment larger than 1,000 square feet in more than half of the major metro areas we analyzed in October.
Renters in Memphis get the most value for their money, with $2,000 being enough to afford a 1,570-square-foot apartment. Birmingham, AL (1,523 square feet), Louisville, KY (1,479 square feet), St. Louis, MO (1,388 square feet) and Houston (1,380 square feet) round out the five metros where $2,000 rents you the most space.
Metros Where $2,000 Rents The Most Space (Square Feet)
| All Apartments | 0-1 Bedroom | 2 Bedrooms | 3+ Bedrooms | |
| Memphis, TN | 1,570 | 1,358 | 1,664 | No data |
| Birmingham, AL | 1,523 | No data | No data | No data |
| Louisville, KY | 1,479 | 1,301 | 1,579 | No data |
| St. Louis, MO | 1,388 | 1,265 | 1,468 | 1,547 |
| Houston, TX | 1,380 | 1,281 | 1,471 | 1,535 |
| Raleigh, NC | 1,334 | 1,153 | 1,440 | 1,504 |
| Indianapolis, IN | 1,333 | 1,168 | 1,448 | 1,537 |
| Cincinnati, OH | 1,331 | 1,189 | 1,189 | 1,445 |
| Cleveland, OH | 1,316 | 1,158 | 1,443 | 1,484 |
| Jacksonville, FL | 1,297 | 1,110 | 1,415 | 1,494 |
The story is very different on the west and east coasts, where rents are more expensive. In San Jose, CA, a renter on a $2,000 budget can only afford a 537-square-foot apartment, the smallest among the most populous metro areas. Compared to Memphis, that’s a difference of more than 1,000 square feet.
Metros Where $2,000 Rents The Least Space (Square Feet)
| All Apartments | 0-1 Bedroom | 2 Bedrooms | 3+ Bedrooms | |
| San Jose, CA | 537 | 491 | 596 | 630 |
| San Francisco, CA | 565 | 520 | 634 | No data |
| New York, NY | 581 | 546 | 651 | 599 |
| Los Angeles, CA | 591 | 549 | 648 | 661 |
| San Diego, CA | 602 | 538 | 655 | 677 |
| Boston, MA | 645 | 568 | 736 | 698 |
| Seattle, WA | 732 | 640 | 875 | 976 |
| Riverside, CA | 752 | 675 | 797 | 848 |
| Providence, RI | 788 | 659 | 885 | No data |
| Miami, FL | 806 | 704 | 862 | 874 |
San Francisco (565 square feet), New York (581 square feet), Los Angeles (591 square feet) and San Diego (602 square feet) round out the five metros where $2,000 rents you the least space.
Metro-Level Summary: October 2024
| Metro Area | Median Asking Rent | Price Per Square Foot | Square Footage
($1,000 Budget) |
Square Footage ($1,500 Budget) | Square Footage ($2,000
Budget) |
Square Footage ($2,500
Budget) |
Square Footage ($3,000
Budget) |
| Atlanta, GA | $1,550 | $1.58 | 632.8 | 949.1 | 1,266 | 1,581.9 | 1,898.3 |
| Austin, TX | $1,504 | $1.71 | 584.9 | 877.3 | 1,170 | 1,462.2 | 1,754.6 |
| Baltimore, MD | $1,595 | $1.73 | 578.8 | 868.3 | 1,158 | 1,447.1 | 1,736.5 |
| Birmingham, AL | $1,352 | $1.31 | 761.7 | 1,142.6 | 1,523 | 1,904.3 | 2,285.1 |
| Boston, MA | $2,729 | $3.10 | 322.6 | 483.9 | 645 | 806.6 | 967.9 |
| Buffalo, NY | $1,350 | $1.70 | 588.2 | 882.4 | 1,176 | 1,470.6 | 1,764.7 |
| Charlotte, NC | $1,495 | $1.58 | 632.1 | 948.1 | 1,264 | 1,580.2 | 1,896.3 |
| Chicago, IL | $1,765 | $2.21 | 451.9 | 677.8 | 904 | 1,129.7 | 1,355.6 |
| Cincinnati, OH | $1,325 | $1.50 | 665.4 | 998.0 | 1,331 | 1,663.4 | 1,996.1 |
| Cleveland, OH | $1,349 | $1.52 | 658.2 | 987.3 | 1,316 | 1,645.5 | 1,974.6 |
| Columbus, OH | $1,450 | $1.57 | 637.8 | 956.6 | 1,276 | 1,594.4 | 1,913.3 |
| Dallas, TX | $1,480 | $1.77 | 566.0 | 849.0 | 1,132 | 1,414.9 | 1,697.9 |
| Denver, CO | $1,764 | $2.17 | 461.0 | 691.5 | 922 | 1,152.5 | 1,383.0 |
| Detroit, MI | $1,405 | $1.54 | 648.4 | 972.6 | 1,297 | 1,621.0 | 1,945.2 |
| Houston, TX | $1,279 | $1.45 | 690.1 | 1,035.1 | 1,380 | 1,725.2 | 2,070.2 |
| Indianapolis, IN | $1,380 | $1.50 | 666.7 | 1,000.0 | 1,333 | 1,666.7 | 2,000.0 |
| Jacksonville, FL | $1,488 | $1.54 | 648.7 | 973.1 | 1,297 | 1,621.8 | 1,946.1 |
| Las Vegas, NV | $1,448 | $1.66 | 601.1 | 901.7 | 1,202 | 1,502.9 | 1,803.4 |
| Los Angeles, CA | $2,780 | $3.39 | 295.3 | 443.0 | 591 | 738.3 | 885.9 |
| Louisville/Jefferson County, KY | $1,249 | $1.35 | 739.6 | 1,109.4 | 1,479 | 1,849.1 | 2,218.9 |
| Memphis, TN | $1,245 | $1.27 | 784.9 | 1,177.4 | 1,570 | 1,962.3 | 2,354.7 |
| Miami, FL | $2,375 | $2.48 | 403.0 | 604.6 | 806 | 1,007.6 | 1,209.1 |
| Minneapolis, MN | $1,624 | $2.03 | 493.6 | 740.4 | 987 | 1,234.1 | 1,480.9 |
| Nashville, TN | $1,521 | $1.68 | 594.0 | 891.1 | 1,188 | 1,485.1 | 1,782.1 |
| New Orleans, LA | $1,234 | $1.60 | 623.2 | 934.8 | 1,246 | 1,558.0 | 1,869.6 |
| New York, NY | $2,800 | $3.44 | 290.5 | 435.8 | 581 | 726.3 | 871.6 |
| Orlando, FL | $1,711 | $1.82 | 550.3 | 825.4 | 1,101 | 1,375.6 | 1,650.8 |
| Philadelphia, PA | $1,840 | $2.14 | 467.6 | 701.4 | 935 | 1,169.1 | 1,402.9 |
| Phoenix, AZ | $1,495 | $1.77 | 564.3 | 846.4 | 1,129 | 1,410.7 | 1,692.8 |
| Pittsburgh, PA | $1,384 | $1.65 | 606.4 | 909.6 | 1,213 | 1,516.0 | 1,819.2 |
| Portland, OR | $1,790 | $2.09 | 477.9 | 716.9 | 956 | 1,194.8 | 1,433.8 |
| Providence, RI | $2,100 | $2.54 | 393.9 | 590.9 | 788 | 984.8 | 1,181.8 |
| Raleigh, NC | $1,445 | $1.50 | 666.9 | 1,000.4 | 1,334 | 1,667.3 | 2,000.8 |
| Richmond, VA | $1,585 | $1.76 | 568.0 | 851.9 | 1,136 | 1,419.9 | 1,703.9 |
| Riverside, CA | $2,313 | $2.66 | 375.8 | 563.8 | 752 | 939.6 | 1,127.5 |
| Sacramento, CA | $1,999 | $2.38 | 419.4 | 629.2 | 839 | 1,048.6 | 1,258.3 |
| Salt Lake City, UT | $1,475 | $1.83 | 546.1 | 819.2 | 1,092 | 1,365.3 | 1,638.3 |
| San Diego, CA | $2,767 | $3.33 | 300.8 | 451.1 | 602 | 751.9 | 902.3 |
| San Francisco, CA | $2,681 | $3.54 | 282.2 | 423.4 | 564 | 705.6 | 846.7 |
| San Jose, CA | $3,234 | $3.72 | 268.6 | 403.0 | 537 | 671.6 | 805.9 |
| Seattle, WA | $2,019 | $2.73 | 365.7 | 548.6 | 731 | 914.3 | 1,097.2 |
| St. Louis, MO | $1,240 | $1.44 | 694.0 | 1,041.0 | 1,388 | 1,735.0 | 2,082.0 |
| Tampa, FL | $1,740 | $1.93 | 518.1 | 777.2 | 1,036 | 1,295.4 | 1,554.4 |
| Virginia Beach, VA | $1,646 | $1.75 | 571.4 | 857.0 | 1,143 | 1,428.4 | 1,714.1 |
| Washington, DC | $2,055 | $2.34 | 426.6 | 639.9 | 853 | 1,066.5 | 1,279.8 |
| National | $1,615 | $1.81 | 551.4 | 827.1 | 1,103 | 1,378.5 | 1,654.2 |
Methodology
Median asking rent figures in this report cover newly listed units in apartment buildings with five or more units. The median is calculated based on a rolling three-month period, i.e., the median asking rent for October 2024 covers rentals that were listed on Rent.com and Redfin.com during the three months ending October 31, 2024.
Metro-level data in this report covers 45 of the 50 most populous U.S. core-based statistical areas (CBSAs)—those for which Rent. and Redfin have sufficient rental data. The national figures are based on data for the entire U.S.
Asking rents reflect the current costs of new leases during each time period. In other words, the amount shown as the median asking rent is not the median of what all renters are paying, but the median asking price of apartments that were available for new renters during the report period.


