
- The median asking rent fell 0.7% year over year in November to $1,595, dropping 1.1% month over month.
- The asking price per square foot for rental apartments fell 2.2% year over year to the lowest level since December 2021.
- Rents dropped across all bedroom counts for the fifth consecutive month.
- Cleveland recorded the biggest rent increase, while Austin, TX posted the biggest decrease.
The median U.S. asking rent fell 0.7% year over year in November to $1,595, the lowest level since March 2022. Rents were down 1.1% on a month-over-month basis.
var divElement = document.getElementById(‘viz1733850940893’); var vizElement = divElement.getElementsByTagName(‘object’)[0]; if ( divElement.offsetWidth > 800 ) { vizElement.style.width=’1344px’;vizElement.style.height=’750px’;} else if ( divElement.offsetWidth > 500 ) { vizElement.style.width=’1344px’;vizElement.style.height=’750px’;} else { vizElement.style.width=’100%’;vizElement.style.height=’1500px’;} var scriptElement = document.createElement(‘script’); scriptElement.src = ‘https://public.tableau.com/javascripts/api/viz_v1.js’; vizElement.parentNode.insertBefore(scriptElement, vizElement);
The median rent is now 6.2% lower than when it hit an all-time high of $1,700 in August 2022.
Highlighting improved rental affordability, November marked the 19th consecutive month where the median asking rent price per square foot (PPSF) fell year over year, down 2.2% to $1.79. That’s the first time the median PPSF has been below $1.80 since November 2021.
!function(){“use strict”;window.addEventListener(“message”,(function(a){if(void 0!==a.data[“datawrapper-height”]){var e=document.querySelectorAll(“iframe”);for(var t in a.data[“datawrapper-height”])for(var r=0;r<e.length;r++)if(e[r].contentWindow===a.source){var i=a.data["datawrapper-height"][t]+"px";e[r].style.height=i}}}))}();
While the rental market has remained essentially flat over the past two years, rents have started to tick down slightly in recent months, thanks in part to the record number of new apartments that have been completed this year.
Nationally, apartment completions rose 22.6% year over year to the highest level in over 12 years in the second quarter. As a result, the vacancy rate for buildings with five or more units rose to 8% in the third quarter, the highest level since early 2021.
“Renters in areas where construction has boomed are in a sweet spot right now. Affordability is improving as rents fall and wages rise, and there is increased choice with more and more new apartment buildings opening,” said Redfin Senior Economist Sheharyar Bokhari. “As construction starts to slow, rents will eventually tick back up, but 2025 is shaping up as a renter’s market with potential for the affordability gap between buying and renting to widen.”
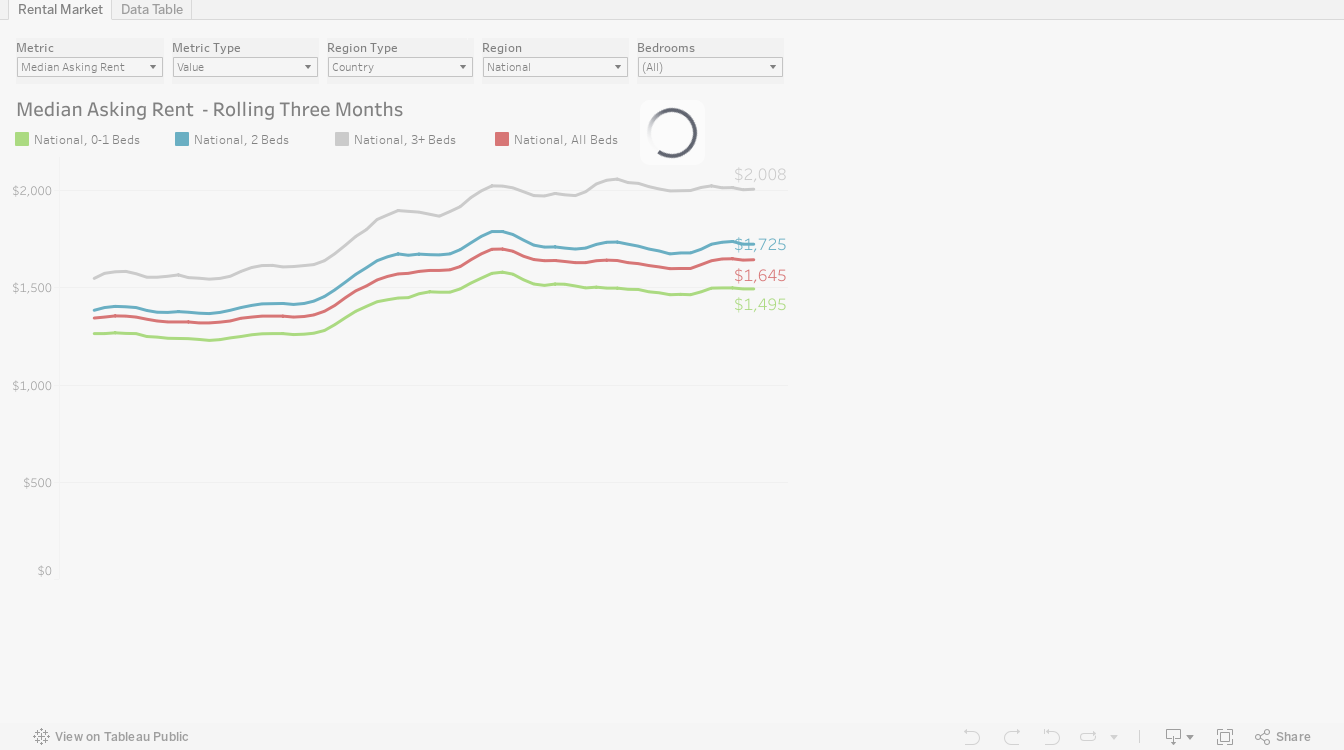
Rents for 0-1 bedroom apartments fall to three-year low
With a major boost in supply, November marked the fifth consecutive month that asking rents fell across all bedroom counts.
Median asking rents for 0-1 bedroom apartments fell 1.7% year over year to $1,450 a month, the lowest level since November 2021. Rents for 2 bedroom apartments fell 1.1% (to $1,671) and 3+ bedroom apartments fell 2.3% (to $1,955).
| Median Asking Rent (Nov) | Median Asking Rent
YoY Change |
Price Per Square Foot YoY Change | |
| 0-1 Bedroom Apartments | $1,450 | -1.7% | -2.5% |
| 2 Bedroom Apartments | $1,671 | -1.1% | -1.2% |
| 3+ Bedroom Apartments | $1,955 | -2.3% | -2.4% |
On a price per square foot basis, the decline was more apparent, with 0-1 bedroom apartments falling the most (-2.5%), followed by 3+ bedroom apartments (-2.4%) and 2 bedroom apartments (-1.2%).
Austin rents drop 12%, leading a number of Sun Belt metros seeing significant declines
As has been the case for most of 2024, of the 44 major metros Redfin analyzes, Sun Belt metros saw the most significant declines in median rents, led by Austin, TX (-12.4%), Tampa, FL (-11.3%), Raleigh, NC (-8.4%), Jacksonville, FL (-7.5%) and Nashville, TN (-7%).
Major Metros With Highest Rent Decreases
| Median Asking Rent (Nov) | Median Asking Rent
YoY Change |
Price Per Square Foot YoY Change | |
| Austin, TX | $1,445 | -12.4% | -15.7% |
| Tampa, FL | $1,740 | -11.3% | -5.0% |
| Raleigh, NC | $1,424 | -8.4% | -7.8% |
| Jacksonville, FL | $1,475 | -7.5% | -5.2% |
| Nashville, TN | $1,506 | -7.0% | -9.9% |
| Denver, CO | $1,710 | -5.7% | -4.7% |
| Seattle, WA | $1,995 | -4.5% | -5.4% |
| New York, NY | $2,798 | -4.2% | -5.8% |
| Orlando, FL | $1,703 | -4.1% | -5.4% |
| Pittsburgh, PA | $1,390 | -3.5% | 2.9% |
Rents rose the most in Midwest and East Coast metros, where there has been less new construction compared to the Sun Belt.
Cleveland posted the biggest increase (10.6%), followed by Louisville, KY (10.2%), Baltimore (9.4%), Washington D.C. (9.4%) and Providence, RI (9.3%).
Major Metros With Highest Rent Increases
| Median Asking Rent (Nov) | Median Asking Rent YoY Change | Price Per Square Foot YoY Change | |
| Cleveland, OH | $1,360 | 10.6% | 9.0% |
| Louisville, KY | $1,236 | 10.2% | 12.2% |
| Baltimore, MD | $1,597 | 9.4% | 5.0% |
| Washington, DC | $2,044 | 9.4% | 10.8% |
| Providence, RI | $2,120 | 9.3% | 7.6% |
| Buffalo, NY | $1,315 | 6.9% | 2.6% |
| Detroit, MI | $1,395 | 6.8% | 7.8% |
| Virginia Beach, VA | $1,600 | 6.8% | 6.6% |
| Chicago, IL | $1,736 | 6.5% | -0.5% |
| Memphis, TN | $1,222 | 6.3% | 2.8% |
Metro-Level Summary: November 2024
| U.S. metro area | Median asking rent | Month-over-month change in median asking rent | Year-over-year change in median asking rent | Median asking rent (PPSF) | Year-over-year change in median asking rent (PPSF) |
| Atlanta, GA | $1,541 | -0.6% | 1.4% | $1.57 | -1.2% |
| Austin, TX | $1,445 | -3.7% | -12.4% | $1.62 | -15.7% |
| Baltimore, MD | $1,597 | 0.1% | 9.4% | $1.72 | 5.0% |
| Birmingham, AL | $1,363 | 0.7% | 6.1% | $1.34 | 20.2% |
| Boston, MA | $2,682 | -1.5% | 4.0% | $3.05 | 2.6% |
| Buffalo, NY | $1,315 | -2.6% | 6.9% | $1.68 | 2.6% |
| Charlotte, NC | $1,484 | -0.4% | -1.5% | $1.57 | -2.6% |
| Chicago, IL | $1,736 | -1.6% | 6.5% | $2.16 | -0.5% |
| Cincinnati, OH | $1,315 | -0.4% | 3.7% | $1.49 | 4.0% |
| Cleveland, OH | $1,360 | 0.8% | 10.6% | $1.52 | 9.0% |
| Columbus, OH | $1,430 | -1.2% | 5.1% | $1.55 | 9.1% |
| Dallas, TX | $1,475 | 0.1% | -2.3% | $1.76 | -1.9% |
| Denver, CO | $1,710 | -2.8% | -5.7% | $2.13 | -4.7% |
| Detroit, MI | $1,395 | -0.7% | 6.8% | $1.54 | 7.8% |
| Houston, TX | $1,259 | -1.6% | 3.9% | $1.43 | -5.2% |
| Indianapolis, IN | $1,358 | -1.5% | -1.9% | $1.49 | -0.4% |
| Jacksonville, FL | $1,475 | -0.7% | -7.5% | $1.52 | -5.2% |
| Las Vegas, NV | $1,444 | -0.1% | -1.8% | $1.66 | 1.1% |
| Los Angeles, CA | $2,785 | 0.3% | -1.3% | $3.37 | -0.9% |
| Louisville/Jefferson County, KY | $1,236 | -1.0% | 10.2% | $1.37 | 12.2% |
| Memphis, TN | $1,222 | -1.8% | 6.3% | $1.24 | 2.8% |
| Miami, FL | $2,356 | -0.6% | -0.8% | $2.46 | 0.6% |
| Minneapolis, MN | $1,579 | -2.6% | 0.6% | $1.95 | 3.1% |
| Nashville, TN | $1,506 | -0.8% | -7.0% | $1.68 | -9.9% |
| New York, NY | $2,798 | -0.1% | -4.2% | $3.41 | -5.8% |
| Orlando, FL | $1,703 | -0.3% | -4.1% | $1.81 | -5.4% |
| Philadelphia, PA | $1,850 | 0.8% | 0.7% | $2.14 | -0.8% |
| Phoenix, AZ | $1,480 | -0.8% | -2.6% | $1.76 | -2.6% |
| Pittsburgh, PA | $1,390 | 0.8% | -3.5% | $1.67 | 2.9% |
| Portland, OR | $1,789 | 0.2% | -0.1% | $2.08 | -4.9% |
| Providence, RI | $2,120 | 1.0% | 9.3% | $2.49 | 7.6% |
| Raleigh, NC | $1,424 | -1.3% | -8.4% | $1.49 | -7.8% |
| Richmond, VA | $1,581 | 0.1% | 4.7% | $1.75 | 7.5% |
| Riverside, CA | $2,290 | -0.9% | 2.0% | $2.63 | 6.1% |
| Sacramento, CA | $1,969 | -1.5% | 1.4% | $2.39 | 0.2% |
| Salt Lake City, UT | $1,466 | -0.6% | -2.6% | $1.81 | -3.7% |
| San Diego, CA | $2,850 | 3.2% | -1.0% | $3.42 | 1.2% |
| San Francisco, CA | $2,677 | -0.1% | -2.4% | $3.54 | -4.2% |
| San Jose, CA | $3,200 | -0.9% | 5.1% | $3.68 | 6.8% |
| Seattle, WA | $1,995 | -1.0% | -4.5% | $2.65 | -5.4% |
| St. Louis, MO | $1,229 | -0.5% | 1.6% | $1.42 | 1.0% |
| Tampa, FL | $1,740 | -0.5% | -11.3% | $1.95 | -5.0% |
| Virginia Beach, VA | $1,600 | -2.7% | 6.8% | $1.72 | 6.6% |
| Washington, DC | $2,044 | -0.3% | 9.4% | $2.33 | 10.8% |
| National | $1,595 | -1.1% | -0.7% | $1.79 | -2.2% |
Methodology
Median asking rent figures in this report cover newly listed units in apartment buildings with five or more units. The median is calculated based on a rolling three-month period, i.e., the median asking rent for November 2024 covers rentals that were listed on Rent.com and Redfin.com during the three months ending November 30, 2024.
Metro-level data in this report covers 44 of the 50 most populous U.S. core-based statistical areas (CBSAs)—those for which Rent. and Redfin have sufficient rental data. The national figures are based on data for the entire U.S.
Asking rents reflect the current costs of new leases during each time period. In other words, the amount shown as the median asking rent is not the median of what all renters are paying, but the median asking price of apartments that were available for new renters during the report period.


